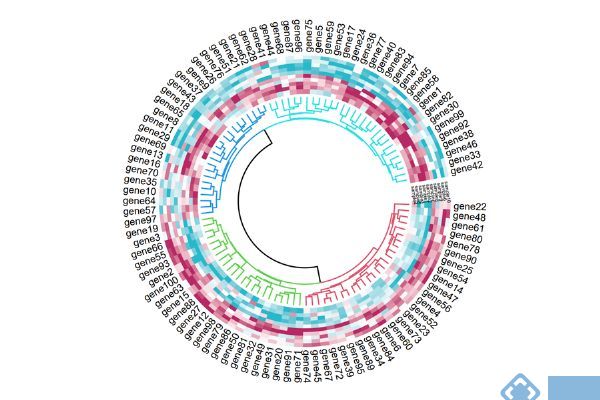
col_fun1 = colorRamp2(c(-2, 0, 2), c("#26B9CB", "#FFFFFF", "#B72865"))##设置热图颜色
column_od = hclust(dist(t(mat1)))$order #对列聚类
circos.par(gap.after = c(10))##为添加列名留出空间
circos.heatmap(mat1[, column_od], ##将列聚类后重新排序的矩阵
col = col_fun1, ##设置颜色
dend.side = "inside",##树状图在圈内
rownames.side = "outside",##行名在圈外
dend.track.height = 0.2,
dend.callback = function(dend, m, si) {
# when k = 1, it renders one same color for the whole dendrogram
color_branches(dend, k = 4, col = 2:5)##对树状图进行着色
}
)
circos.track(track.index = 2, ##将列名添加在第二个轨道(就是热图所在的环形轨道)
panel.fun = function(x, y) {
if(CELL_META$sector.numeric.index == 1) { # the last sector
cn = colnames(mat1[, column_od])##取得列名
n = length(cn)
circos.text(rep(CELL_META$cell.xlim[2], n) + convert_x(1, "mm"), ##x轴坐标
1:n - convert_y(0.5, "mm"), ##y轴坐标
cn, ##输入要展示的列名
cex = 0.25, ##列名的大小
adj = c(0, 0.5),
facing = "inside")
}
}, bg.border = NA)
circos.clear()
```
图2
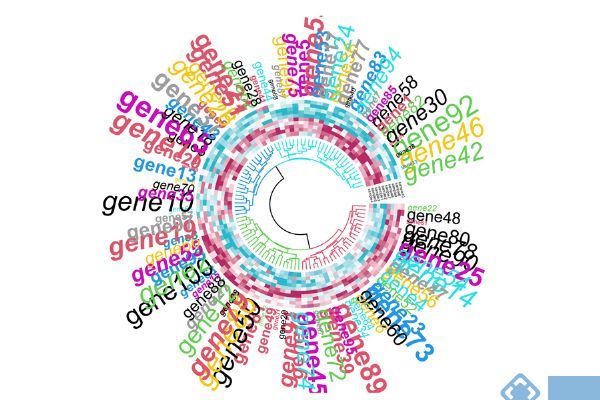
2> 修改文字的大小(rownames.cex)。字体(rownames.font)和颜色(rownames.col),使用代码4,结果见图3。
```
##代码4
col_fun1 = colorRamp2(c(-2, 0, 2), c("#26B9CB", "#FFFFFF", "#B72865"))##设置热图颜色
column_od = hclust(dist(t(mat1)))$order #对列聚类
circos.par(gap.after = c(15))##为添加列名留出空间
circos.heatmap(mat1[, column_od], ##将列聚类后重新排序的矩阵
col = col_fun1, ##设置颜色
dend.side = "inside",##树状图在圈内
rownames.side = "outside",##行名在圈外
rownames.col = 1:nrow(mat1) %% 10 + 1,##行名添加颜色
rownames.cex = runif(nrow(mat1), min = 0.3, max = 2),##行名的大小
rownames.font = 1:nrow(mat1) %% 4 + 1,##行名字体
dend.track.height = 0.2,
dend.callback = function(dend, m, si) {
# when k = 1, it renders one same color for the whole dendrogram
color_branches(dend, k = 4, col = 2:5)##对树状图进行着色
}
)
circos.track(track.index = 2, ##将列名添加在第二个轨道(就是热图所在的环形轨道)
panel.fun = function(x, y) {
if(CELL_META$sector.numeric.index == 1) { # the last sector
cn = colnames(mat1[, column_od])##取得列名
n = length(cn)
circos.text(rep(CELL_META$cell.xlim[2], n) + convert_x(1, "mm"), ##x轴坐标
1:n - convert_y(0.5, "mm"), ##y轴坐标
cn, ##输入要展示的列名
cex = 0.25, ##列名的大小
adj = c(0, 0.5),
facing = "inside")
}
}, bg.border = NA)
circos.clear()
```
图3
参考文献


